II. Methods
<<
>>
A. Methodological Challenges in Qualitative Data Analysis
Working through data for this project was a challenging process. From May 2016 through February 2017, I collected two terabytes of screen recordings, video recordings, drafts, notes, and other contextual materials representing hundreds of hours of webtext composing. I tried multiple approaches to make sense of these data. I transcribed hours of video data; I open-coded alphabetic Inventio narratives for emerging categories; I catalogued every change across drafts from first web prototype to final submission; I made a paper model of one final draft and cut it apart to identify its various components; I made another paper model of all web drafts for one project and used transparencies to visualize the slow buildup and rearrangement of layers over time. Each of these approaches gave me a partial glimpse into the invention influences behind a tiny sliver of data.
However, none of these approaches helped me to see what I was looking for: a synthesized overview of changes across drafts and the influences behind these changes, that captured the experience of what it was like to be a composer negotiating with these influences in the midst of an ongoing invention process. I needed an analytical approach for synthesizing multiple kinds of data into a coherent, comprehensible overview, that would additionally enable me to develop codes for invention influences applicable to other composers’ narratives.
Furthermore, I wanted to represent the data in a way that embraced and foregrounded its multimodal nature, rather than relying solely on alphabetic description as an analytical mode. I thus needed to develop an approach 1) that complemented the nature of the data collected, 2) that enacted the principles of multimodal design-as-argument this project works to theorize 3) that could be applied across autoethnographic, narrative, and interview data alike, 4) that could provide a visual overview of change across time, and 5) that would help to bring salient influences to the surface amidst a mass of contextualizing data. The following section describes my process for developing and enacting an analytical method that would meet these requirements. It provides the conceptual background necessary for understanding multimodal data (images, charts, tables, and videos) presented in the following three body chapters, in which I demonstrate and represent my analytical process.
B. Developing an Analytical Framework
In this project, I rely on a definition of invention suited especially to visually rich digital spaces, drawing from Delagrange and Garrett et al.: Invention is closely related to arrangement, and new ideas come out of (and are reflected by) the juxtaposition of pieces and materials. For the purpose of this project, I define “piece” as a component of a webtext with a distinct rhetorical purpose that serves to facilitate the overall user experience. If invention is a systematic process for coming up with new ideas (Glenn and Goldthwaite), I want to map influences on webtext composers’ systematic processes for juxtaposing pieces in order to generate new ideas (and thus implicit designs-as-argument) via webtext design, with particular intention to layout. I especially want to identify influences on process of inventing a webtext’s “inscape,” or its unique structural design comprised by the total interrelationship of all its components. In other words, I want to map systems that generate a webtext’s total design structure (inscape), and the implicit design-as-argument that this structure performs.
To identify the influences behind shifts in inscape with the data collected, I developed an analytical approach to trace these systems of influences on pieces’ juxtaposition and their implications for design-as-argument. I worked closely with Miles, Huberman, and Saldaña’s guide to qualitative data analysis.1
As a means of boiling down two terabytes of multimodal data into manageable chunks, I draw from Miles, Huberman, and Saldaña’s description of “dramaturgical coding,” an interpretive approach based on the conventions of theater that seeks to map relationships between actors: “[Dramaturgical coding] applies the terms and conventions of character, play script, and production analysis onto qualitative data […]. [This method] is appropriate for exploring intrapersonal and interpersonal participant experiences and actions in case studies, power relationships, and the processes of human motives and agency” (76). For the purposes of this project, I extend discussions of “actors” and “agency” to include nonhuman as well as human actors.2 I do not necessarily want to stick closely to theatrical conventions and terminologies, but I do want to identify key agents behind the production of each draft that emerged from the analytic memos. In so doing, I can map relationships and characterize the nature of their impacts on drafts as they develop. In other words, I want 1) to parse what was going on “behind the scenes” of webtext invention and design and 2) to begin to identify some of the “key players,” their interrelationships, and the nature of their impact on a webtext’s developing inscape.
I thus turned toward a grounded theory-inspired analytical approach to visually represent qualitative narrative data through the analytic process of “icon-coding,” or assigning symbols to represent narrative agents and their relationships. I used this approach to generate models that represent selected key segments from my corpus, which I then used to account for and analyze other segments of the corpus more flexibly and holistically as needed. This approach builds on Miles, Huberman, and Saldaña’s discussion of accounting for visual analysis, particularly their claim that a reflective analytical memoing approach can be more appropriate for visual-heavy data:
In the case of my projects, I want to “interview” myself as autoethnographic composer by systematically observing my reactions to webtext drafts as “still visual documentation.” Through this procedure, I could record the “influences and affects” that emerged as most salient to me in reflecting back on the invention process (and resulting inscape) behind a particular draft. Although these reflections would not be exhaustive, they could be used to generate an initial set of codes for describing the actors and actions “behind the scenes” of inventing a webtext’s inscape.
To implement my adapted analytical method, I selected four drafts from each of the three autoethnographic case studies: the first web design draft, the final web design draft, and two intermittent “key drafts.” These drafts are summarized in Tables 5 through 7. I define “key drafts” as those that demonstrate significantly different inscapes, or structural arrangements of pieces in their web layout designs. Although this approach does not fully account for every change in every intermittent draft, it does provide an overview of major structural changes through selected “snapshots” in time. I then timed myself and performed fifteen minutes of analytic memoing (Miles, Huberman, and Saldaña 98) about my impressions of each draft as composer in response to the questions “Why did I choose that draft?” and “Why is it arranged in that particular way?” During this phase of analysis, I returned to these questions periodically between memoing sessions to make sure I was staying on track.
Tables 5-7 summarize the selected key drafts for each case study and the rationale behind their selection.
Table 5: Selected drafts for “Dancing Across Media”
| Draft ID | Draft Date | Reason for Selection |
|---|---|---|
| DM1 | 5 October 2016 | This draft is the first hands-on attempt at web design brainstorming for the project. |
| DM2 | 14 November 2016 | This draft is the first substantial attempt at web design brainstorming for the project. |
| DM3 | 12 January 2017 | This draft reflects a significant change in the layout of the interior pages. |
| DM4 | 10 February 2017 | This is the final submitted draft. |
Table 6: Selected drafts for “The Magpie's Nest”
| Draft ID | Draft Date | Reason for Selection |
|---|---|---|
| MN1 | 12 December 2016 | This draft is the first hands-on attempt at web design brainstorming for the project. |
| MN2 | 26 December 2016 | This draft is the first substantial attempt at web design brainstorming for the project. |
| MN3 | 9 January 2017 | This draft is the first with all the review media pieces in place. |
| MN4 | 2 February 2017 | This is the final submitted draft. |
Table 7: Selected drafts for “Religion, Remediated”
| Draft ID | Draft Date | Reason for Selection |
|---|---|---|
| RR1 | 6 November 2016 | This draft is the first hands-on attempt at web design brainstorming for the project. |
| RR2 | 11 November 2016 | This draft is the first HTML-based attempt at web design for the project. |
| RR3 | 26 November 2016 | This draft is the most substantial web-based version of the project to date. |
| RR4 | 1 August 2017 | This is the final submitted draft. |
This process resulted in twelve focused reflections (four per case study) on three webtexts’ developing inscapes, as focalized through the interpretive perspective of the composer.3 This approach to engaging my data is an autoethnographic variation on a “discourse-based interview” (Katz, Odell et al.), an established researched method in technical communication. As Katz describes, “A discourse-based-interview seeks to uncover the tacit information that writers use when they write for organizational purposes. The interview takes the form of a structured series of questions based on texts that the writer has written or with which the writer is familiar” (32). The goal of a discourse-based interview is to “reveal organizational discourse conventions” by “offer[ing]” the writer alternative versions of specific parts of the text and ask[ing] about differences between the two” (32). In this case, I want to reveal patterns in invention influences by looking at four successive drafts of the same text and asking myself to account for differences in their overall arrangements. The fifteen-minute time limit was intended to help me focus on the most important invention influences that came to mind, rather than attempting to account for every possible influence or association.
In the following discussion, I will use the term “reflection narratives” to describe the documents produced during the analytic memoing period. As with any interview, these narratives are based on my reflections, and therefore offer an interpretive lens based on my perspective as composer rather than a comprehensively “accurate” summary. However, I checked my reflection narratives against my extensive autoethnographic documentation for further support, and additionally embed contextualizing data files in the chapters’ web versions to similarly immerse the reader in the composing process.
C. Applying Icon-Coding as Analytical Method
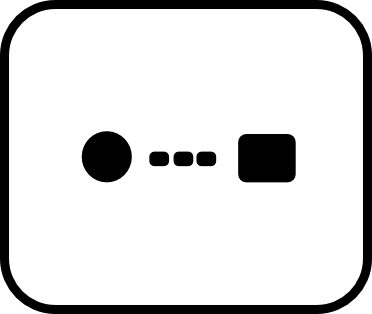
After completing reflection narratives for the twelve selected autoethnographic drafts (four drafts from each of the three projects—see Tables 5-7), I then performed the first stage of icon-code analysis. Reading closely through these composing process reflections, I began to create code-based illustrations to represent systems of invention influences behind each draft’s inscape. I call these code-based illustrations “icon-codes.” I use “icon-codes” to refer to individual codes and “inscape invention map” to refer to the completed code-based illustration. I started with a set of icon-codes that initial immersion in the data had suggested might be especially salient invention influences: people, tools, pieces, and metaphors. Initial reading of my own project along with the three Inventio narratives suggested that these impacts might be common influences on invention in webtext design not only in my own experience, but in the experiences of other webtext composers as well. I added icons as they emerged in order to represent the systems that were being described in the reflection narrative. Each emerging code was assigned a distinct icon based on a geometric shape, and their impacts on each other were represented by lines, with arrows to indicate the direction of influence.
Overall, as illustrated in Figure 3, the codes and categories that emerged from an initial coding pass were: people, tools, metaphors, time, location, navigation, documents, sources, breakdowns, impacts, drafts, pieces, aesthetic experience, and ideas. The resulting interrelated systems of icons are not representations of the draft itself, but rather an interpretive, analytical illustration of impacts on the invention process behind a particular structural arrangement or inscape, grounded closely in the reflection narrative data. Some aesthetic attention was paid to the inscape invention maps in order to represent data in a clear and pleasing way, reflecting the fact that qualitative data analysis is always an act of interpreting experience (Corbin and Strauss 48; Miles, Huberman, and Saldaña 11). These illustrated inscape invention maps (an example of which is presented in Figure 4) identify major invention influences and impacts on changes in inscape across four key drafts from three autoethnographic case studies. These maps will serve as the basis for my analytical discussion.
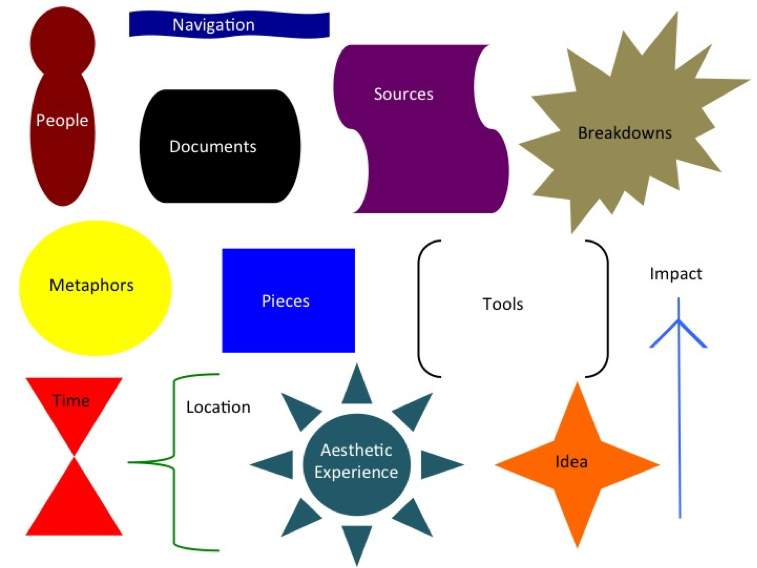
Figure 3: Icon-code key. This key represents each of the icon-codes that emerged from analyzing reflection narratives.
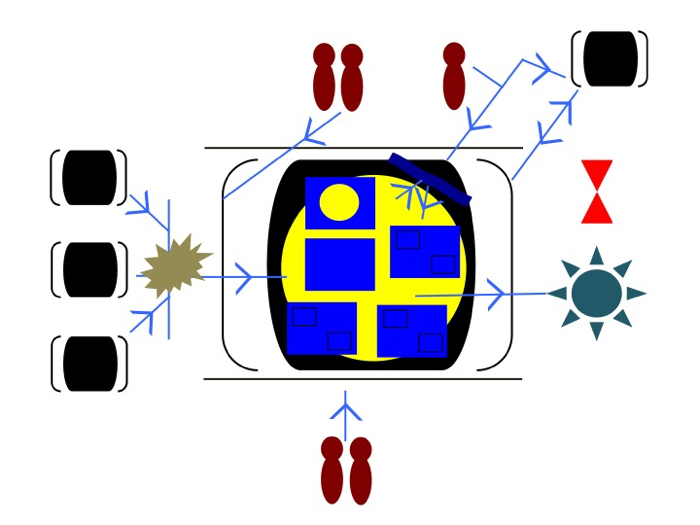
Figure 4: Example inscape invention map for Draft 4 of "The Magpie's Nest." This image presents an example inscape invention map from draft MN4. The icon-codes include people, tools, metaphors, documents, time, breakdowns, and aesthetics. The activity this image represents is narrated in the Case Study Hub ("The Magpie's Nest," Key Draft 4).
D. Selecting Analytical Lenses for Examining Inscape Changes
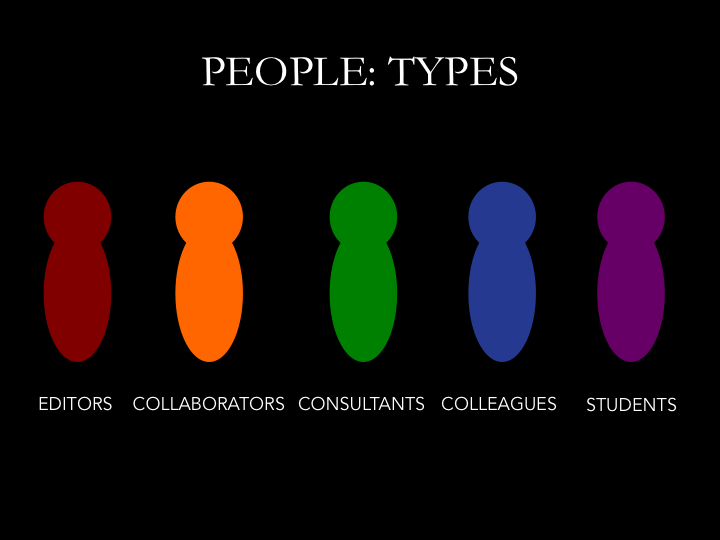
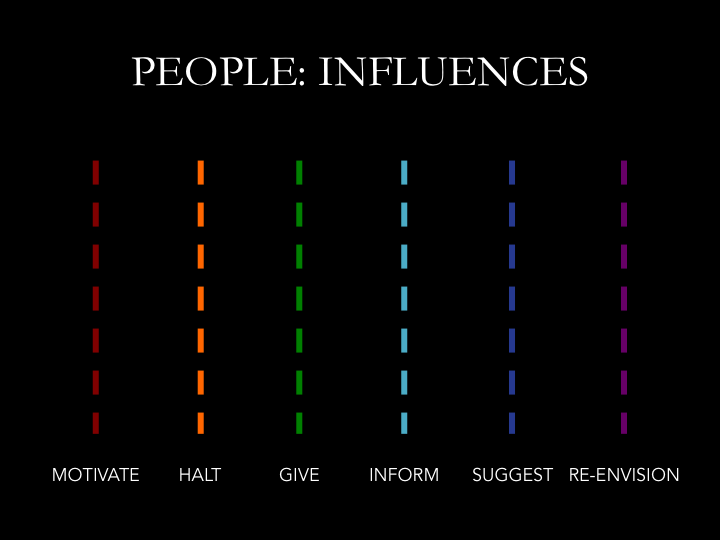
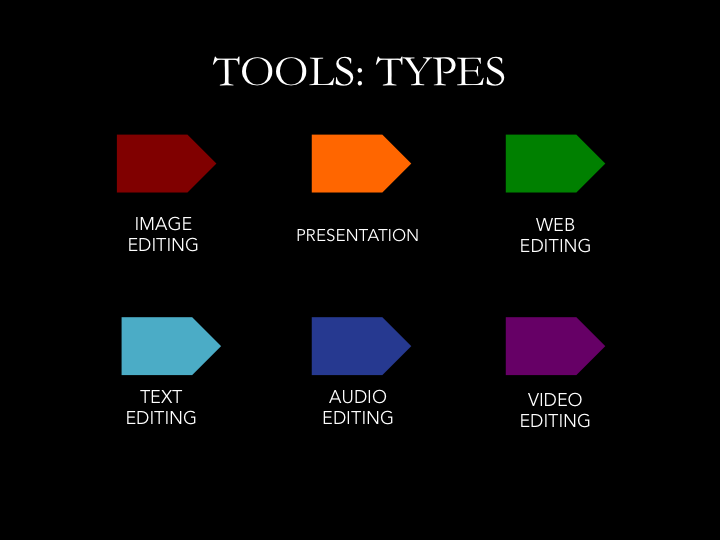
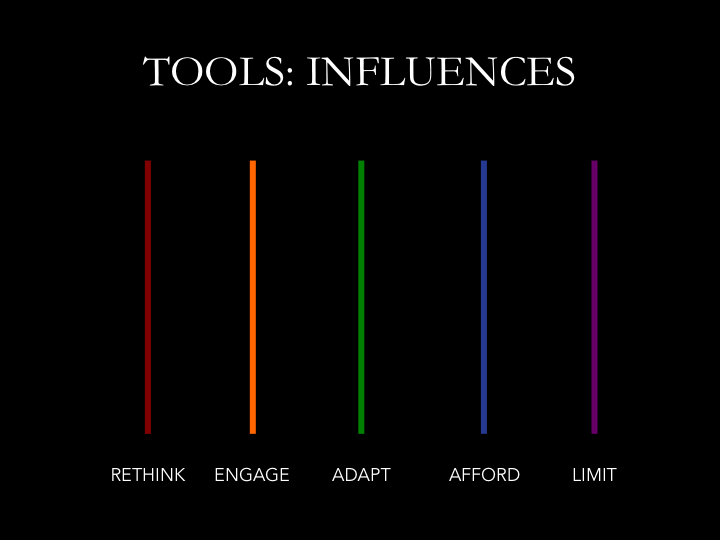
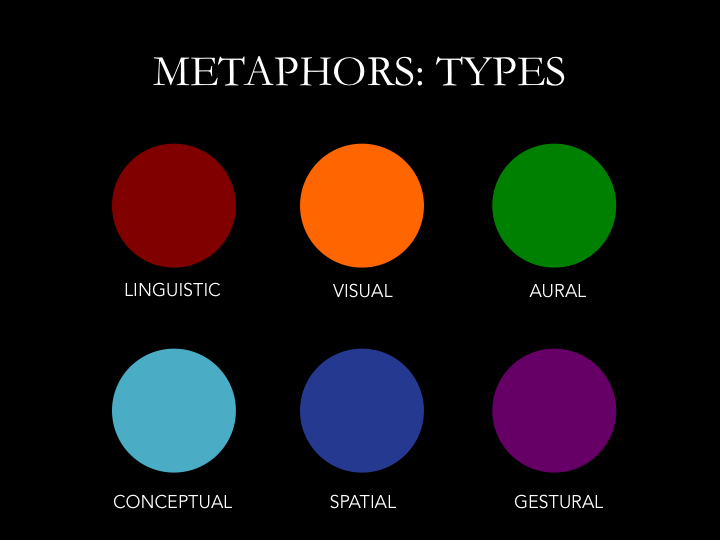
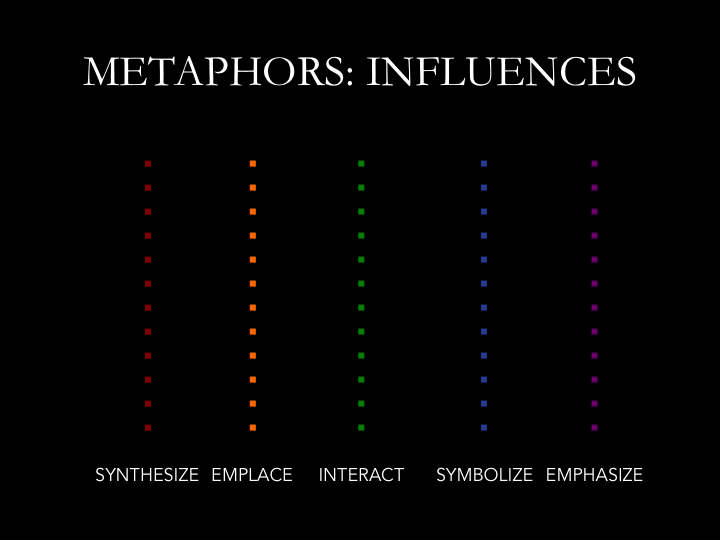
Even with these drastically simplified contextual drafts, it is beyond the scope of this chapter to fully account for every invention influence on its own terms. My body chapters will focus on the invention impacts resulting from the influences of “people”, “tools”, and “metaphors.” There are a number of influences I could have chosen from, as seen in Figure 3 and the numerical breakdown from the first round of coding as presented in Table 8. People, tools, and metaphors, however, tended to cause the most significant changes in the interface design and overall inscape.4 These three codes capture external material concrete entities that make key impacts on the project’s design.5 These codes also served as ways to summarize the other influences. For example, sources tended to come from particular people, and time and space were contextual but not responsible for concrete impacts; something as broad as aesthetic influences might be discussed somewhat more concretely through the lens of metaphor. Documents additionally had a significant presence as an icon-code. However, I chose not to engage this code because the “documents” were frequently previous drafts or other versions of the case study project, and I wanted to focus to focus on the configuration of design elements as they appeared in the selected key draft. Furthermore, focusing on these three codes enable me to discuss impacts on webtext invention through social (“people”), material (“tools”), and cognitive (“metaphors”) lenses, three domains of human experience which Buehl identifies as broad but “productive starting points for considering the complexity of rhetorical action” (20-21). Through these three domains of human experience, I investigate influences on the webtext invention process through the composer’s reflections.
Table 8: Icon-codes numerical breakdown from the first coding round.
| Draft6 | RR1 | RR2 | RR3 | RR4 | MN1 | MN2 | MN3 | MN4 | DM1 | DM2 | DM3 | DM4 | Ttl |
|---|---|---|---|---|---|---|---|---|---|---|---|---|---|
| People | 3 | 4 | 2 | 2 | 0 | 0 | 0 | 5 | 4 | 2 | 1 | 6 | 29 |
| Documents | 7 | 6 | 5 | 2 | 5 | 3 | 3 | 4 | 1 | 2 | 2 | 3 | 43 |
| Sources | 6 | 0 | 0 | 0 | 0 | 0 | 0 | 0 | 0 | 0 | 0 | 0 | 6 |
| Time | 0 | 0 | 2 | 2 | 2 | 3 | 1 | 1 | 0 | 0 | 0 | 0 | 11 |
| Location | 0 | 0 | 0 | 0 | 1 | 0 | 0 | 0 | 0 | 0 | 0 | 0 | 1 |
| Metaphors | 4 | 3 | 1 | 2 | 6 | 5 | 4 | 2 | 1 | 1 | 1 | 1 | 31 |
| Aesthetic | 0 | 2 | 1 | 2 | 5 | 4 | 1 | 1 | 1 | 1 | 0 | 1 | 19 |
| Tools | 0 | 3 | 0 | 1 | 3 | 1 | 1 | 2 | 2 | 2 | 0 | 1 | 16 |
| Ideas | 0 | 0 | 1 | 0 | 0 | 0 | 0 | 0 | 0 | 0 | 0 | 0 | 1 |
| Breakdowns | 0 | 4 | 4 | 2 | 3 | 1 | 5 | 1 | 2 | 0 | 1 | 3 | 26 |
Reflection narratives provide a condensed overview of the invention processes behind a particular draft’s inscape. However, because these narratives were impression-based, they did not provide a comprehensive summary of the drafts’ total “pieces” or components. After categorizing “people’s” types of “impacts,” I icon-coded each draft for “pieces” based on media type and location in the project. Webtexts are complex documents made up of numerous components, for which there is as yet no broadly accepted, standardized descriptive vocabulary. Although it is beyond the scope of this project to provide a complete systematic taxonomy of webtext terms and components, my preliminary taxonomy offers a baseline that can be built on through future research.
I categorize “pieces” by location in the document (base, navigation, splash, code, total, text, and media). These icon-codes for “pieces” are represented in Figure 5. The codes for a piece’s location in the document developed out of my tendency as a composer to focus on rhetorically significant sections of the design during a session.7 The “pieces” categories given here are meant as working descriptions to visualize major changes in a webtext’s overall design over time from the composer’s perspective of an in-progress document, rather than an exhaustive set of categories
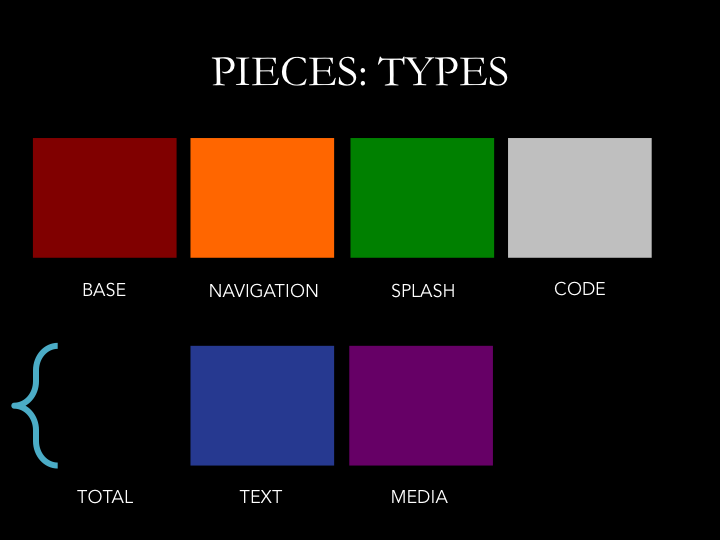
Figure 5: Icon-codes for pieces. This image presents icon-codes for pieces based on document location (base, navigation, splash, code, total, text, media).
I then combined the draft icon-codes with the process icon-codes to present a combined visualization that illustrates how people impact pieces in the webtext invention process. These combined visualizations are likewise presented in each analysis chapter’s “Findings” section.
To check the generalizability of these codes and categories, I additionally applied them to seven webtext composers’ narratives beyond my own. Along with my reflection narratives generated in response to the autoethnographic case studies, I also look at three Inventio narratives and four interview narratives, as presented in Table 9. These examples were selected based on their similarities to the autoethnographic case studies in terms of publication location and formal structure, and they are not representative of all webtext scholarship by any stretch of the imagination. However, it is my hope that limiting my study to relatively comparable webtext types will foreground similarities in invention processes and influences. Future projects might explore the applicability of these codes and categories to invention processes behind other types of webtexts, as a way perhaps of further distinguishing the intellectual work and nuances of design-as-argument behind various kinds of multimodal scholarship.
Table 9: Other composers’ webtext invention narratives8
This table presents the selected case studies for examining other composers’ invention processes. The Inventio narratives were selected from Kairos Journal’s Inventio section, which is explicitly devoted to process narratives about developing webtext scholarship. The interview narratives come from projects published in Computers and Composition Online and Stories That Speak to Us, an edited collection published by Computers and Composition Digital Press.
Having described my adapted analytical approach for engaging my data, I now briefly consider the implications icon-coding might have for qualitative analysis more broadly before discussing the results this method yielded.
<<
>>